

Your search for powerful business insights is here
Trusted by the world’s best brands, Milieu connects you to consumers globally for impactful market research.
Trusted by the world’s top brands


Over 100+ million surveys completed to date
Explore how Milieu empowers data-driven companies to:
Accelerate product-market fit
Gain insights into must-have features, optimal pricing, and user needs for rapid product-market alignment
Tap into trending topics for impactful marketing
Utilise real-time data on evolving consumer interests to craft engaging marketing campaigns and stay ahead of your competition
Gain that
extra edge
Move beyond demographics to understand the motivations of your audience, enabling you to create products and messaging that resonate
Test concepts with speed & agility
Get instant feedback on ideas, campaigns, and features, enabling swift iteration and avoiding costly mistakes
Refine your brand for maximum impact
Uncover the true perception of your brand in the market and optimise messaging to stand out
Conquer new markets with data-driven expansion
Minimise risks in new market expansion by leveraging insights into demand and consumer behaviour
Unlock these and many more possibilities with Milieu
Here’s what our clients say about us
When I was searching for a survey tool, I extensively researched numerous options. Out of all the choices available, Milieu emerged as the obvious winner. It is incredibly user-friendly and visually appealing which makes the job of creating surveys a joy.
Paul Davis
Head of User Experience at Webflow
I personally think Milieu is the most innovative research platform which provides a cost-effective method with high data quality. With Pmax as well as our clients, Milieu is a game-changer as they've helped fuel the work we do with meaningful customer understanding data to build strong foundation for critical strategic decisions.
Cuong Nguyen
Strategy Director

Working with Milieu over the past few years has been a game-changer for our brand lift studies across multiple campaigns. Their team is extremely supportive and consistently delivers high-quality reports that provide invaluable insights. These reports have been instrumental in helping our clients make informed decisions regarding their media buys. Milieu's commitment to excellence and their comprehensive approach make them an indispensable partner to carry Brand Lift Studies.
Kunal Verdia
Head of Digital Investment, GroupM Vietnam
From the initial scoping of the project through to the final analysis, the Milieu team’s expertise and professionalism was outstanding! The data analysts synthesised all of the research findings into an insightful, relevant report, allowing for clear takeaways for the ecosystem. We give Milieu Insight our highest recommendation for any company looking to deeply understand industry dynamics, consumer attitudes, and white space opportunities.
Lindsay Davis
Founder

Our experience working with Milieu as a research company was nothing short of excellent. From start to finish, Milieu Insight made the research experience and methodology smooth and easy to navigate. Not only did they provide insightful results, but they also delivered some surprising findings that we wouldn't have uncovered without their expertise. Their team was highly responsive, communicative, and reliable, which made the whole process stress-free. Additionally, we were grateful for the great infographics that Milieu provided, which helped us to visually represent our research results effectively. Overall, we highly recommend Milieu Insight for anyone looking for a reliable and knowledgeable research partner.
Eva Taase
Program Manager
.svg.avif)
Working with the Milieu team on our anti-discrimination survey was seamless, efficient and a truly collaborative effort. The team gave us valuable feedback on what an effective questionnaire would look like, and was always understanding of any changes we needed to make to the timeline. The team was prompt to respond to our data analysis needs upon completion of the survey, and patiently walked us through their interface so we could make the best use of it. They also helped answer any questions and address any needs we had throughout our media planning around the launch of the results and went above and beyond to create graphics that have been incredibly useful in summarising the top-line findings. Overall, Milieu's work has been essential to our advocacy, and we are extremely grateful for all their efforts. Thank you!
Shailey Hingorani
Head of Research and Advocacy

Our SEA team had the pleasure of working with Milieu on a 3-market study and I must say that their exceptional services left a lasting impression. Their wealth of experience in research and methodology was evident from the get-go, and we were thoroughly impressed with their professional expertise. We obtained some very interesting insights that have proven to be invaluable for our marketing strategy –prompting us to explore new platform avenues for our next outreach. They are a team of experts that are truly passionate about what they do, and it shows in their work.
Jane Goh
Head of Marcom, Southeast Asia

We’re able to offer our clients a higher level of insight and accuracy because of the quality and depth of data Milieu Insight’s Canvas provide, at the speed with which it can be augmented. We are already able to build planning segments for our clients that were not possible before, which gives us greater ability to drive return on marketing investment.
JP Salustiano
Chief Strategy Officer, Dentsu Services

‘’Working with Milieu has helped us better understand the key drivers behind eCommerce in Southeast Asia and the results have helped reinforce our trajectory, while also providing businesses and sellers valuable market insights to guide critical business decisions which helps them to determine their growth and focus in this digital economy.’’
James Chang
Chief Business Officer, Lazada Group.

Check out the latest insights and innovations on our blog

love & relationships
Your Next Boo Might Come From Your Friend Group or Social DMs
Across Southeast Asia, dating apps are not winning the war; mutual friends are. A new survey of 2,500 singles over 35 maps a region where how and whether people look for love looks very different depending on where they live.

love & relationships
Time Is Ticking: SE Asia's Journey of Hitting 35 and Looking for Love
A new survey of 2,500 adults above 35 across Southeast Asia reveals that men fear that time is running out, while women fear ending up with the wrong person out of desperation
Societal Insights
SEA’s Financial Independence from the Childhood Bedroom
New research from Milieu's 2026 Solo Economy Study reveals why living with family is the dominant housing choice across Southeast Asia — and how it's becoming a smart financial strategy, not a step backward.
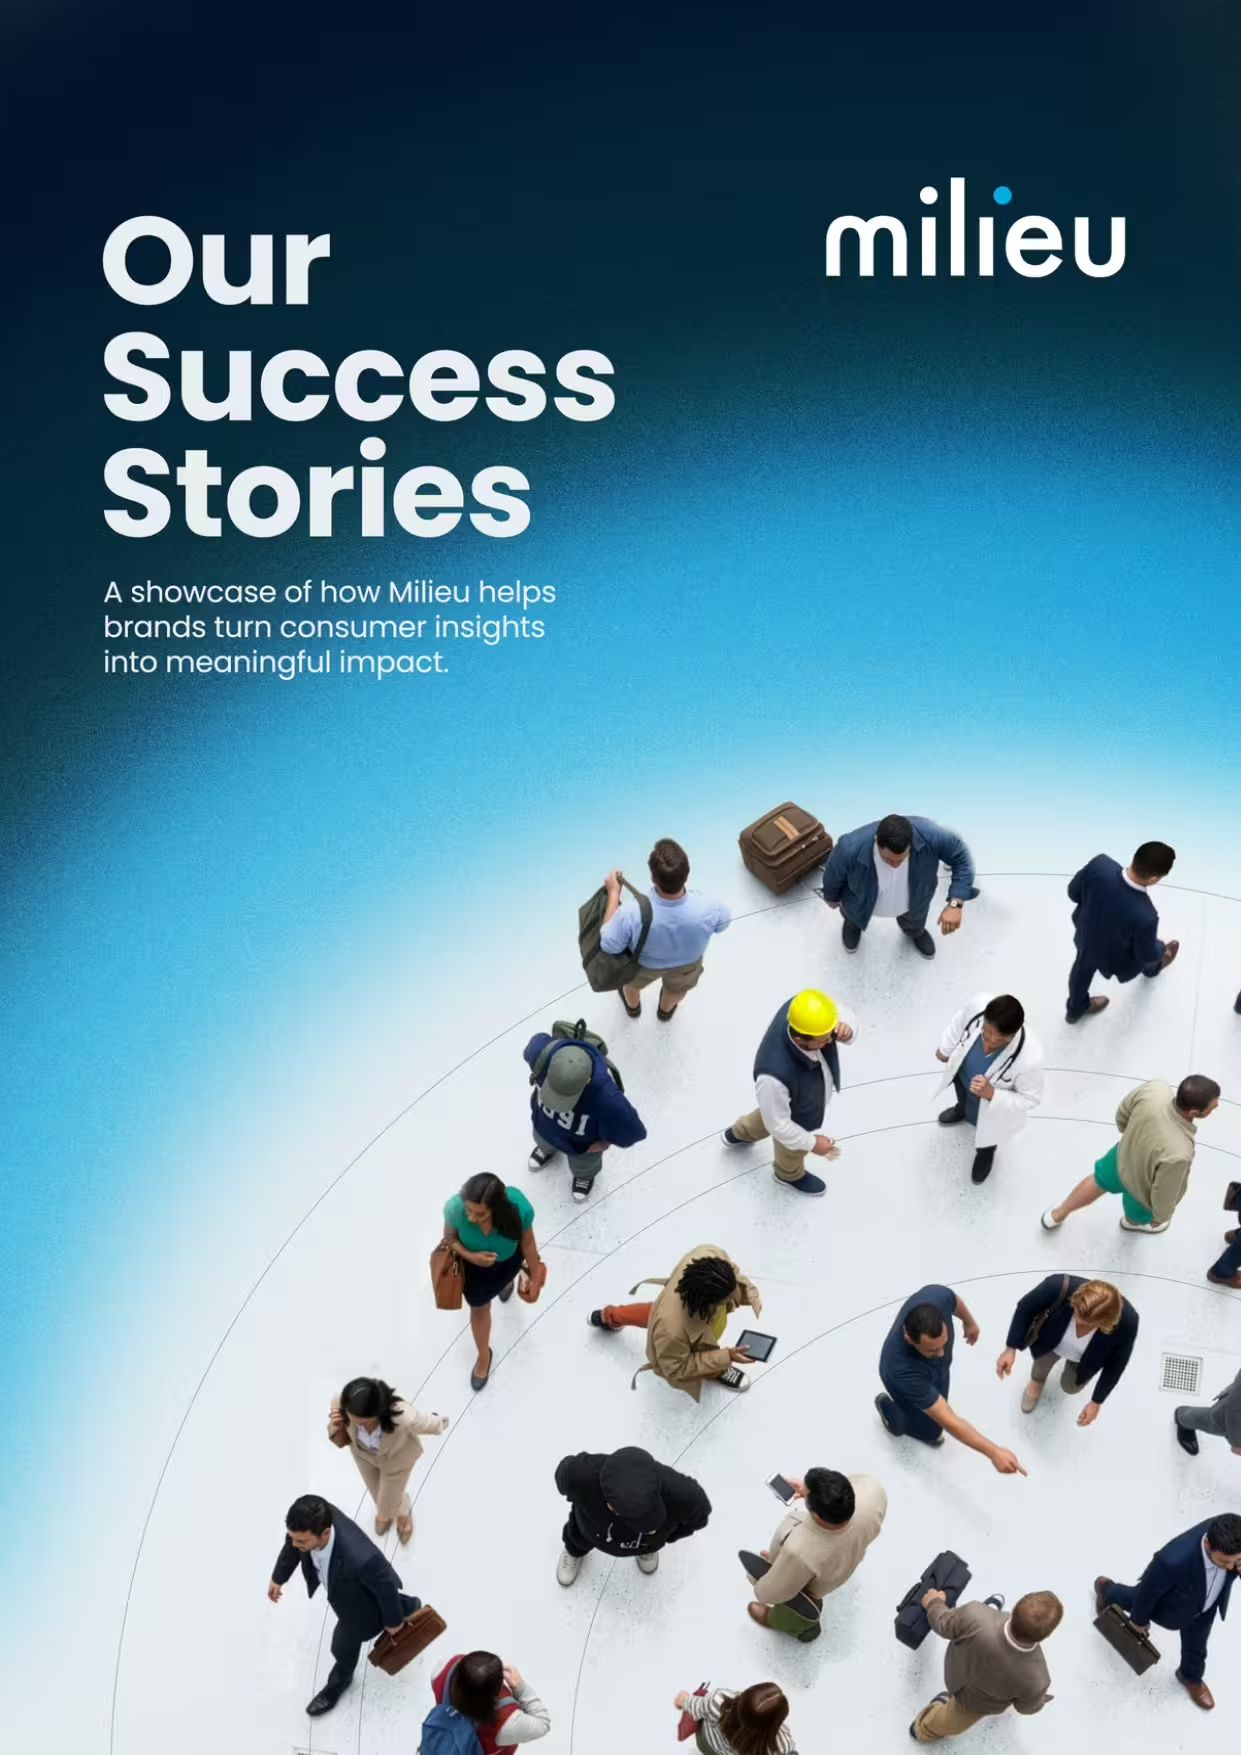
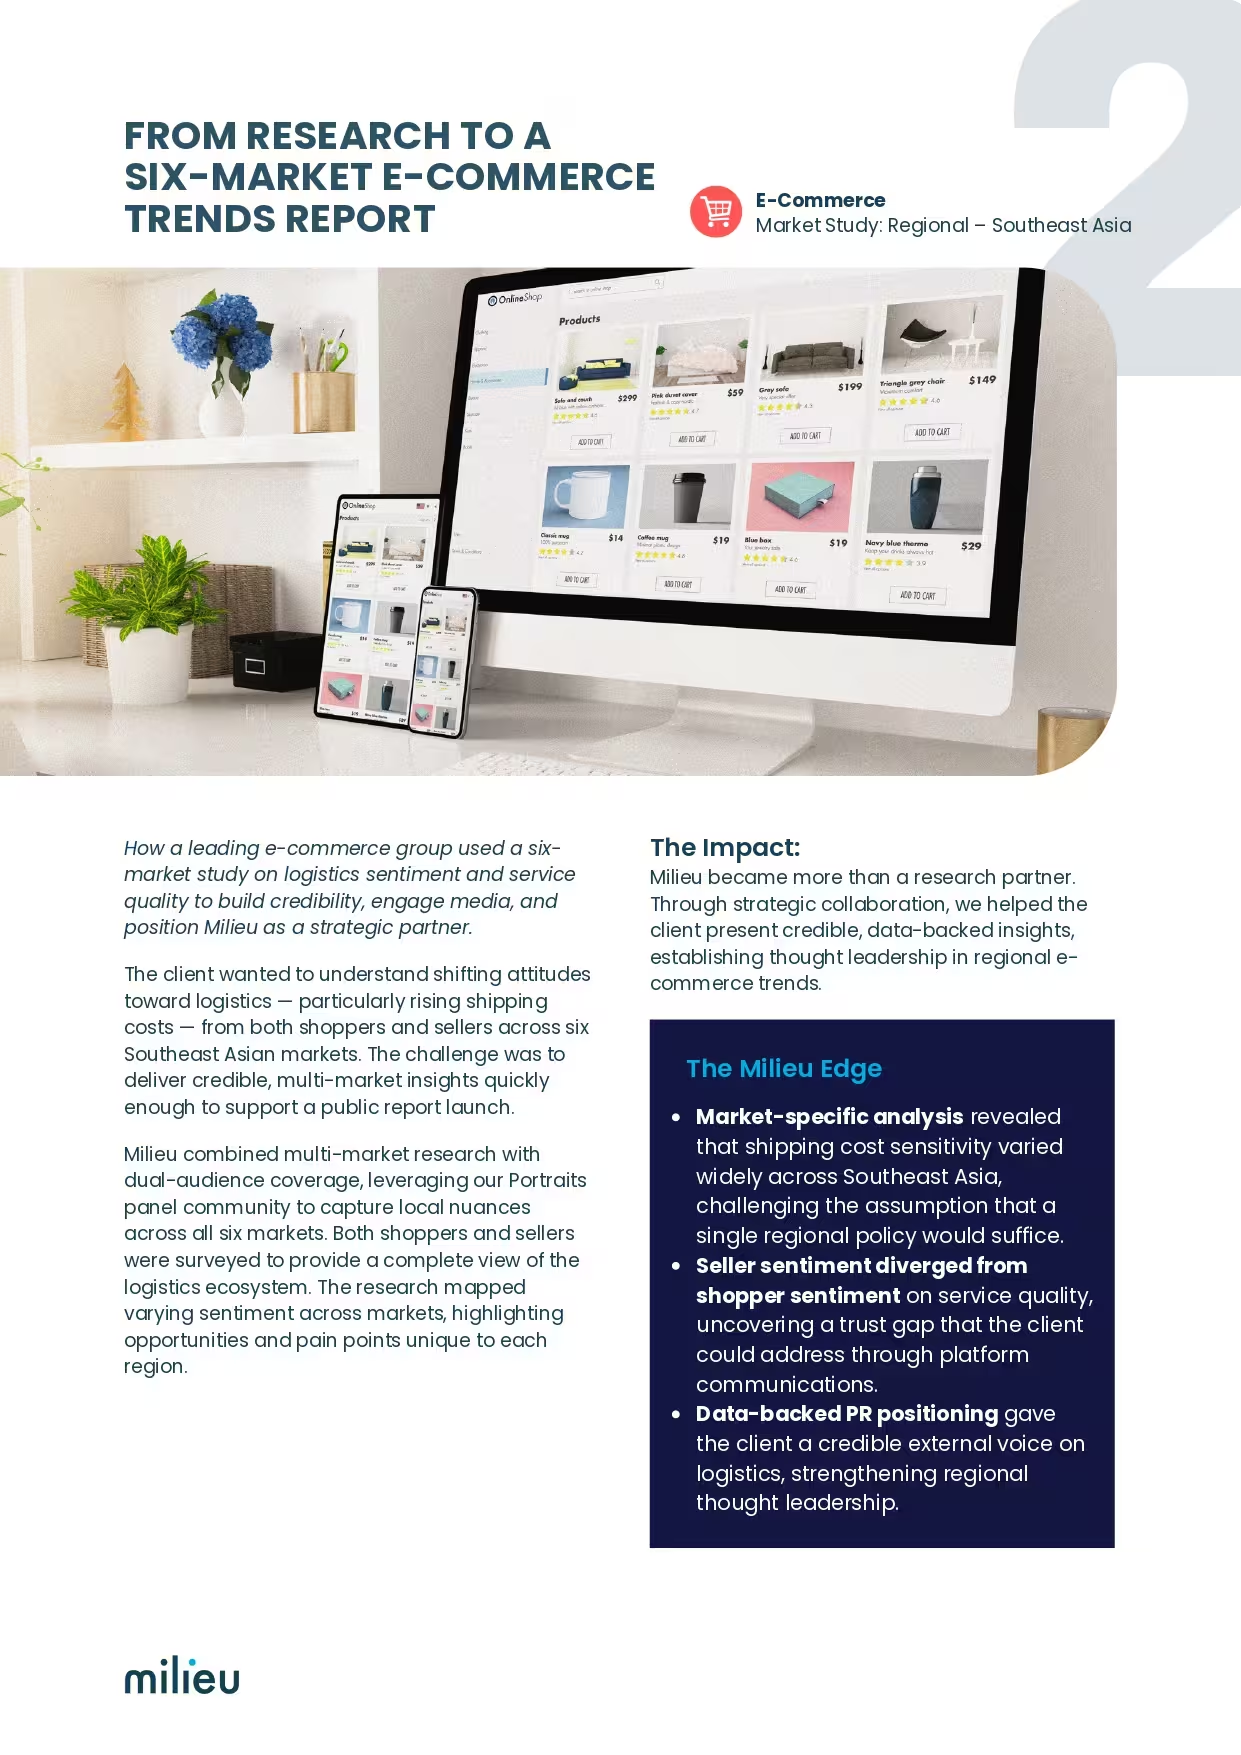
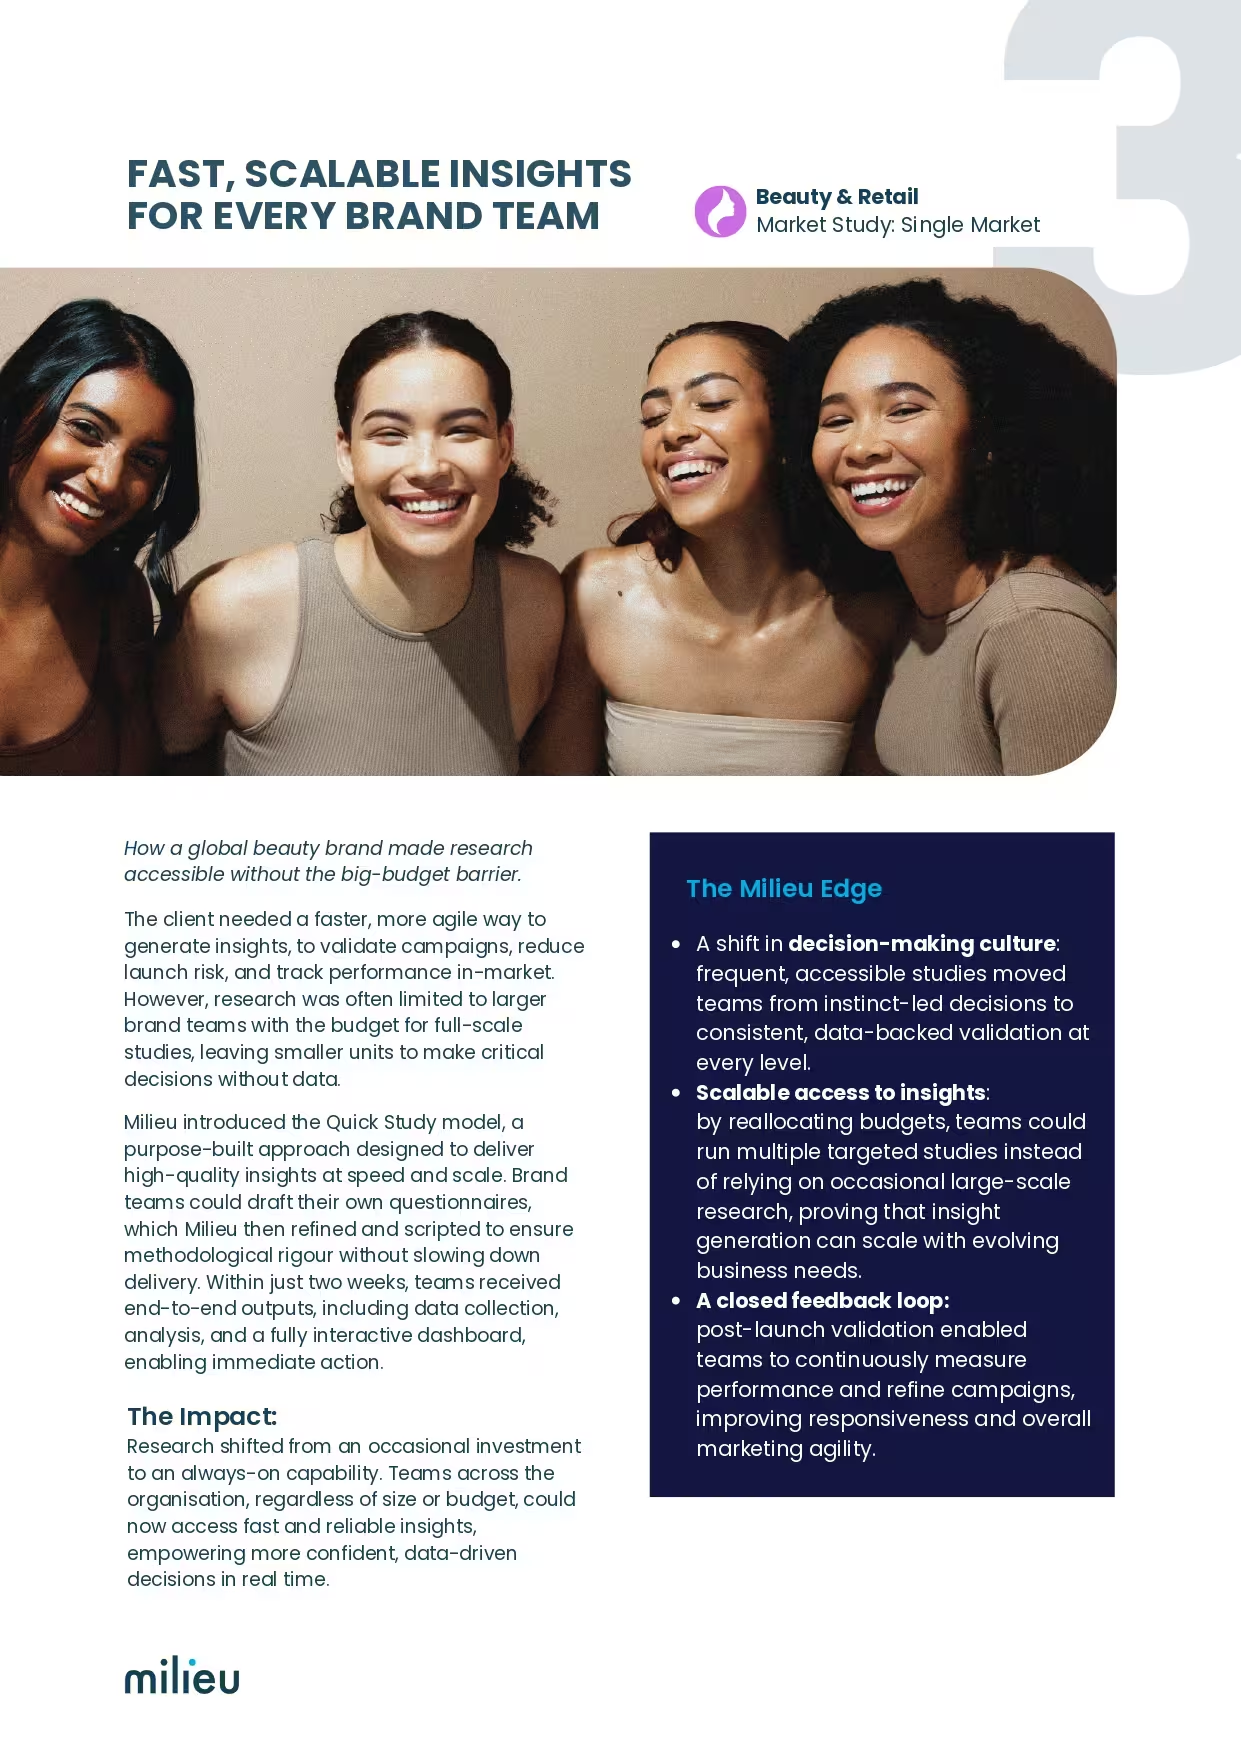
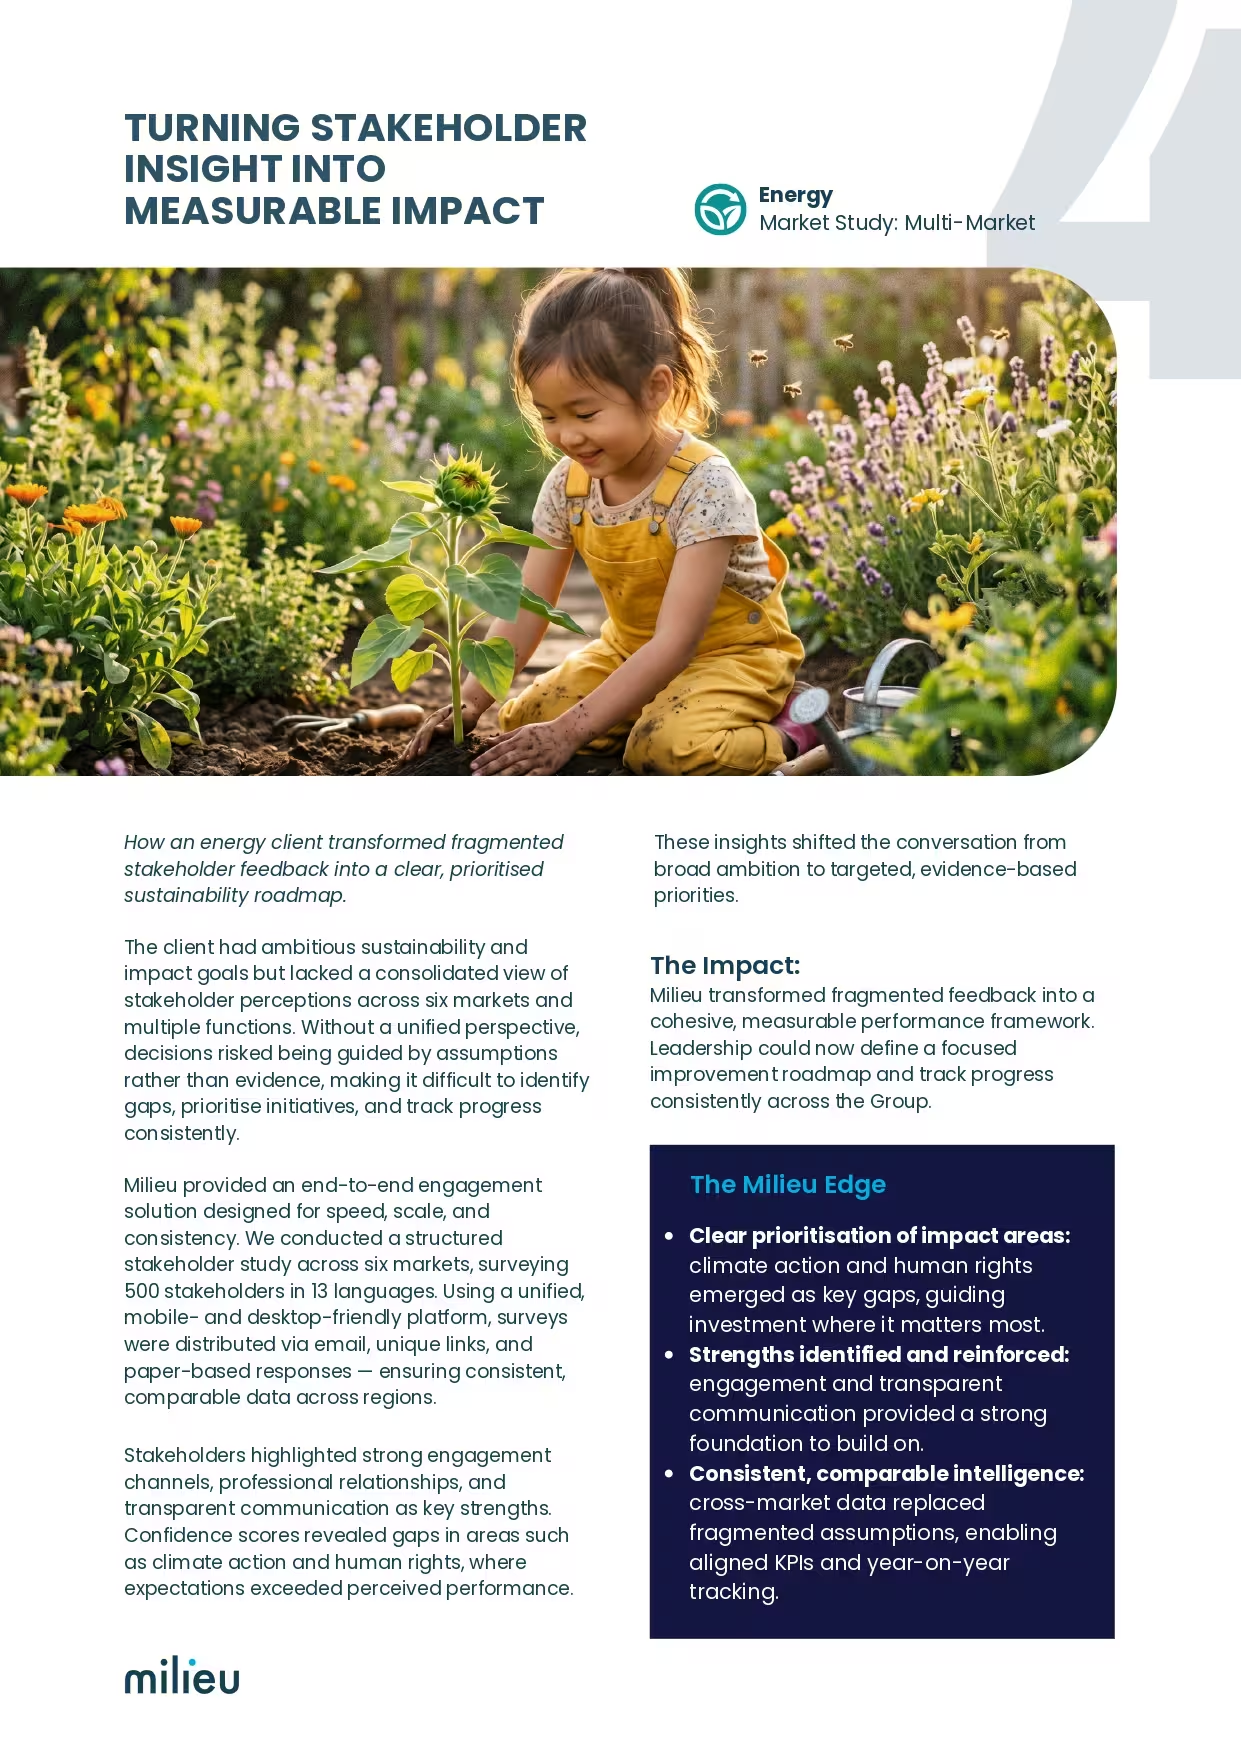
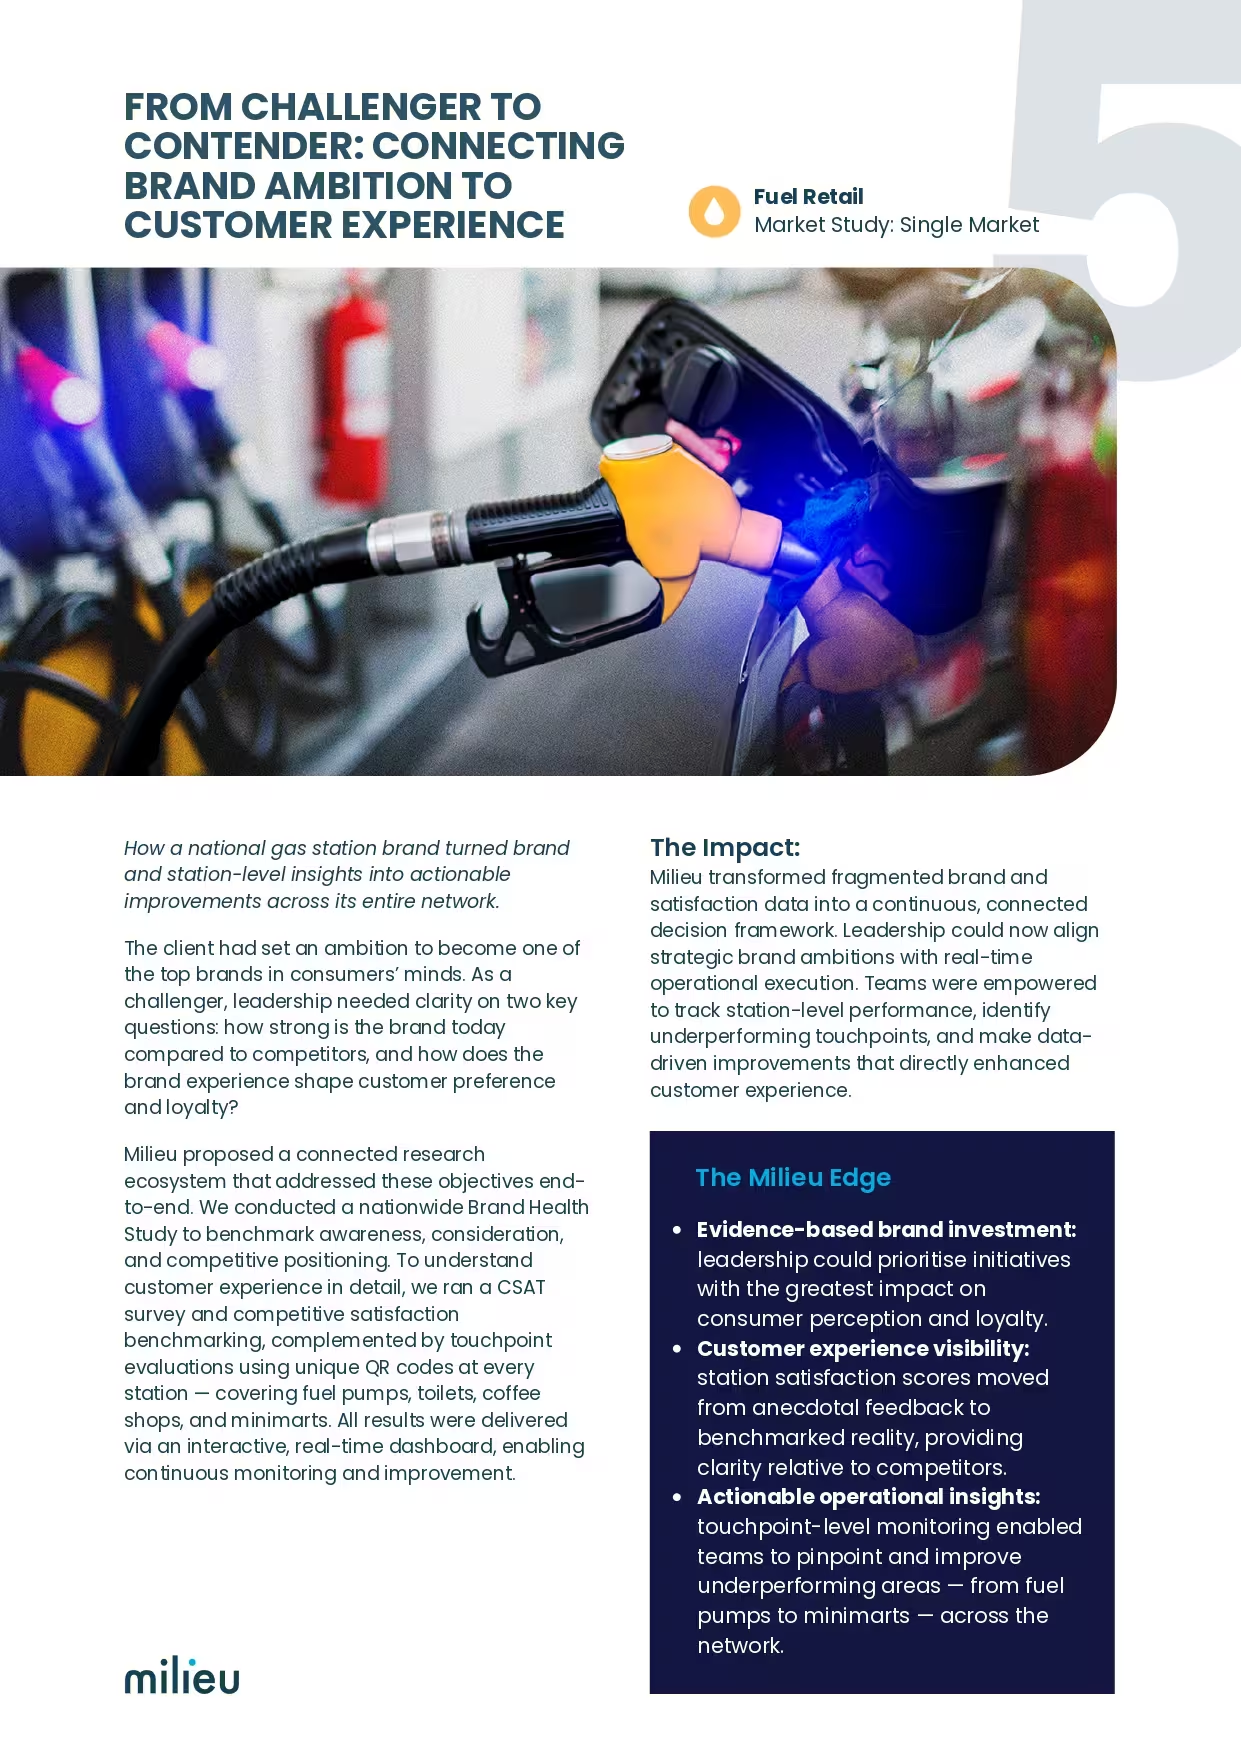
What does research look like when it actually drives impact with Milieu?
We asked ourselves the same question. The answer is in our latest publication: five industries, five stories, one Milieu edge.
Download and take a look how your brand can do the same
Download and take a look how your brand can do the same
Ready to elevate your insights game?
Take the first step towards data-driven excellence.
Contact Milieu today.
Contact Milieu today.
Contact us

