.avif)

Cultural Bias: Insights from cross-cultural survey experiments.

Cross-country surveys often involve questions with Likert-type rating scales. Top-2 box percentages or mean scores are then compared to assess regional differences (or similarities) in people’s attitudes and behaviour.
However, this assumes that people across different countries understand and respond to rating scales in a similar manner. The reality is that there are inherent cultural differences in the way people use rating scales. The meaning attached to Strongly Agree or a 6 on a 10-point scale may differ depending on where you come from .
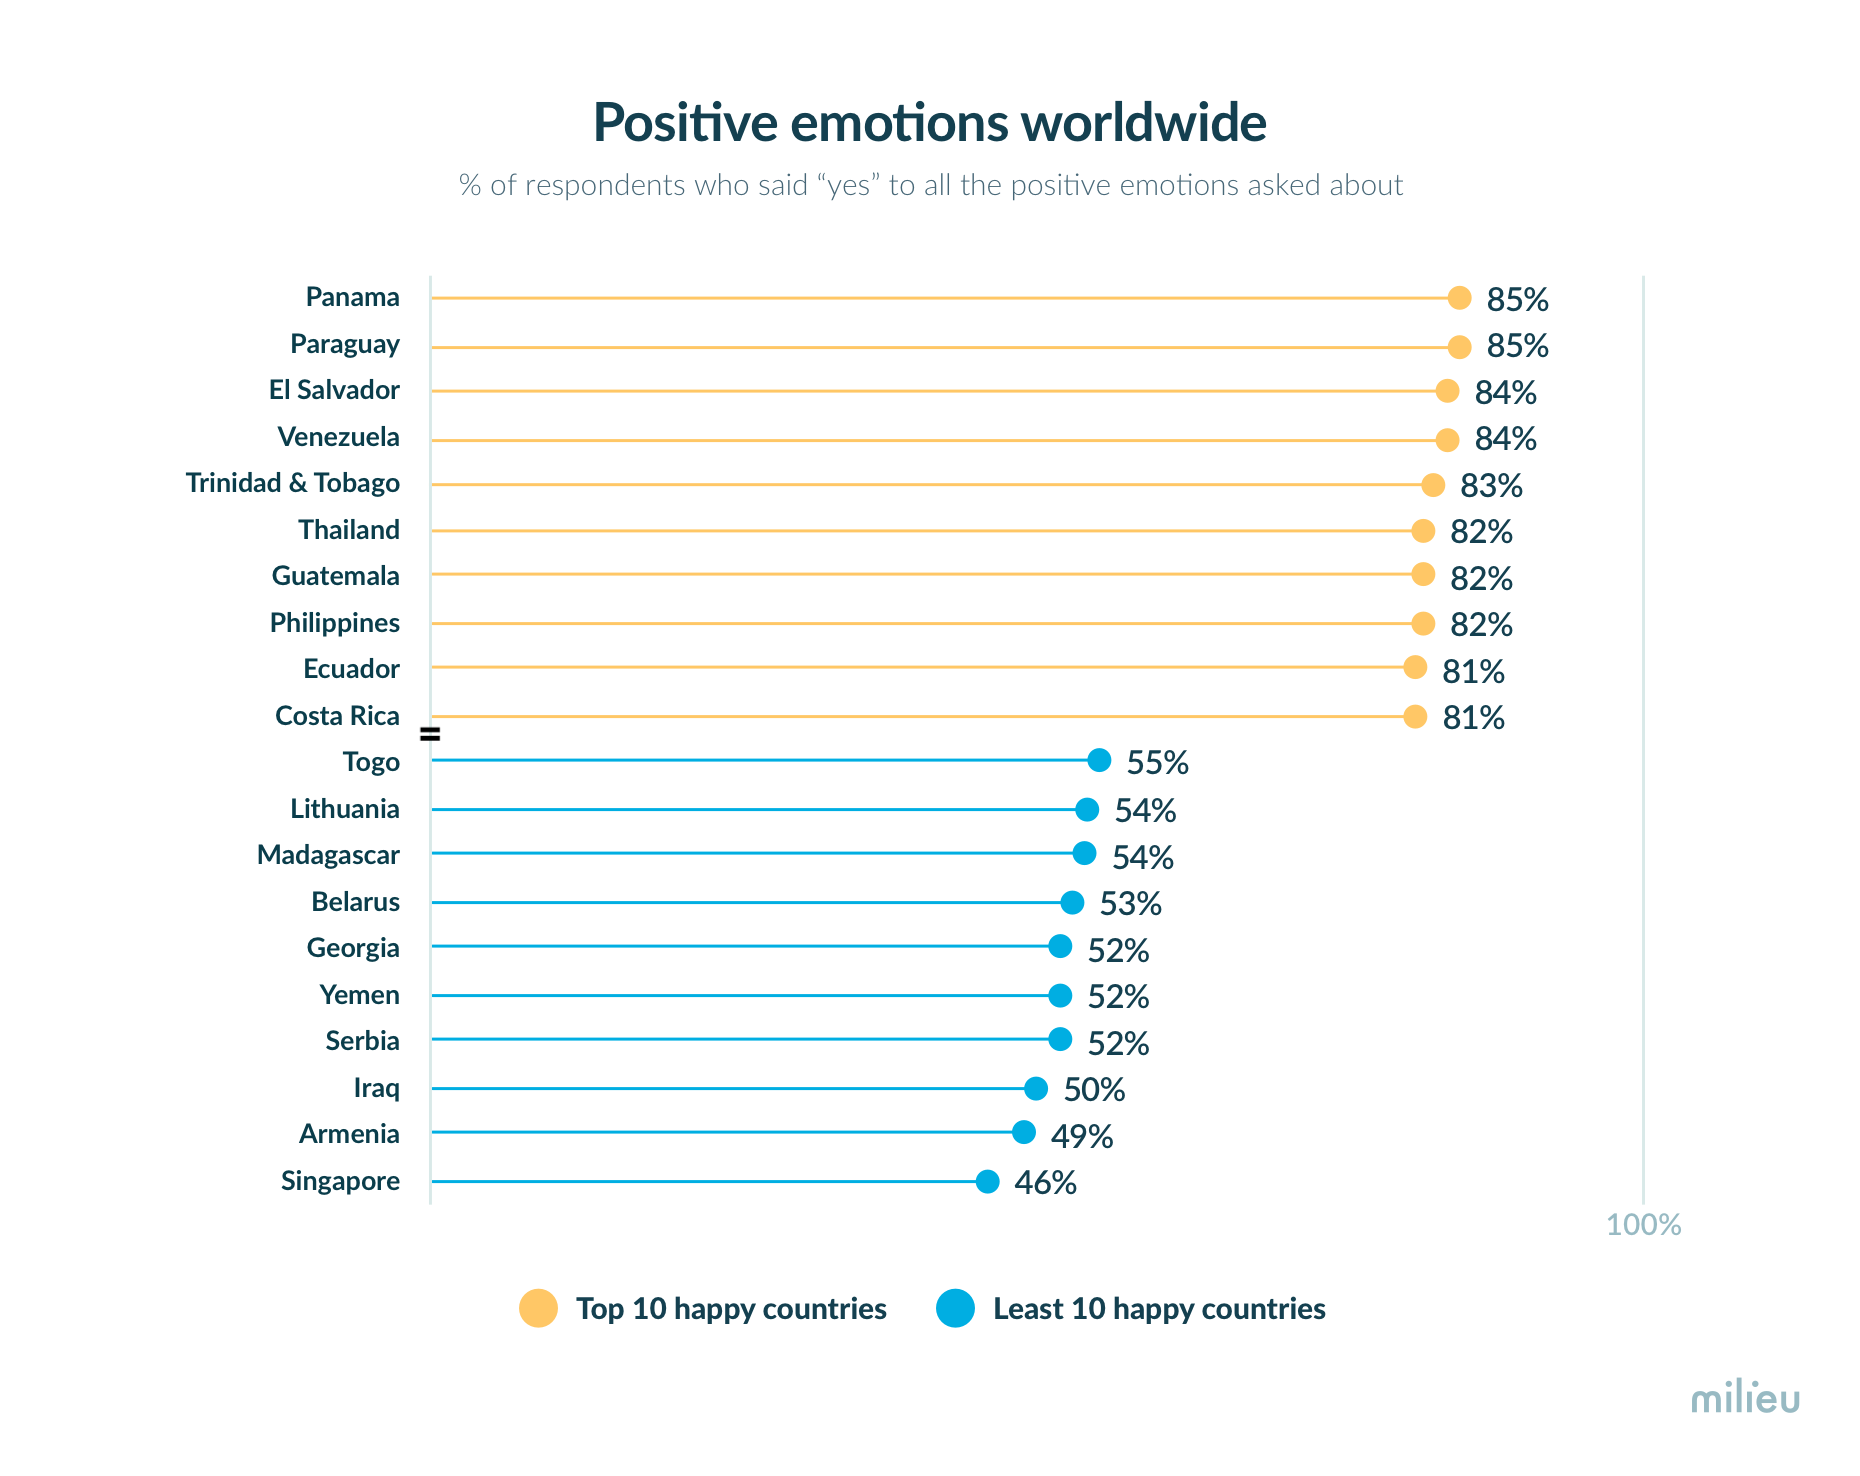
For instance, let’s take a look at a 2012 Gallup poll that was run across 148 countries to measure “Happiness” levels. The results of the survey led to some intriguing findings :
1. Eight of the top 10 countries for positive emotions worldwide belong to Latin America
2. Singapore was the least happy country despite being a socially and politically stable nation with one of the highest GDP per capita
This by no means assumes that happiness is only defined by these variables, but researchers surmised that there is a possibility that the differences aren’t just reflective of happiness levels but that they also capture systematic differences in response styles of different cultures.
A study by Harzing (2006) comparing 26 countries found just that as seen below :
"There are major differences in response styles between countries. Country-level characteristics such as power distance, collectivism, uncertainty avoidance and extraversion all have a positive influence on response styles such as acquiescence (likelihood to agree with something) and (positive) extreme response styles..Respondents from Spanish-speaking countries show higher extreme responses and acquiescence while Japanese and Chinese respondents tend to be far less extreme in their response styles.”
Many other peer-reviewed studies have also found effects of culture on response styles. For instance, Dolnicar and Grün (2007) found that Australian respondents selected extreme responses more often than Asian respondents (Chinese, Indonesian, Indian, and Malaysian) across multiple studies.
Furthermore, In another study, Yu & Yang (2015) compared 14 different countries on their ratings in customer engagement metrics across B2B and B2C brands. They found that English-speaking, and North and South American countries tend to provide higher ratings compared to non-English-speaking East Asian and Western European countries.
What does this mean for cross-country research?
This highlights the importance of taking great care while designing cross-country surveys and taking into consideration various cultural factors while interpreting the results.
In light of this, we ran a set of controlled experiments to assess whether respondents from different countries consistently vary in the way they respond to rating scale, and if they do what are the patterns observed.
Ensuring a robust methodology, we designed the experiments with the aim of assessing whether there are cultural differences in response styles:
1. Across different scale lengths (e.g., 5-point scale, 7-point scale, 11-point sale)
2. Across different subject matter / question topics (e.g., customer satisfaction, product test, general attitudinal questions). General attitude questions involved attitudinal questions that measure subjective opinions, emotions, perceptions, or judgments on matters related to every day life. In the product test section, we showed respondents images of two products to capture the impression of the product’s packaging and its impact on purchase intent. In customer satisfaction questions, we got respondents to rate how satisfied they are with their current smartphone brand.
3. Across different types of response scales (e.g., agreement scales, likelihood scale, etc.)
Experimental Study Design
To this end we designed four surveys with varying scale lengths namely, 5-point scale, 6-point scale, 7-point scale and 11-point scale. Each survey had the same set of 24 questions to maintain consistency and comparability.
The 24 questions in the survey included a mix of different question topics and types of scales as mentioned above. The studies were run in six markets namely, Singapore, Philippines, Indonesia, Vietnam, Malaysia and Thailand. Sample sizes ranged from N = 300 to 500 and were representative of their markets in age, gender and region.

Here is the summary of the results observed
1. Top-choice selection rate : Some countries tend to be consistently choose the top choice regardless of the length of the rating scale
The first aim was to assess whether any patterns emerge when we compare top-box scores across different scale lengths (i.e. 5-point scale, 6-point scale, 7-point scale and 11-point scale). By top-box we mean what percentage of respondents select the highest option on the scale.
What we found is that on average, across all scales, Vietnam and Philippines are most likely to select the top-box rating compared to other countries. On the contrary, Singapore was the least likely to pick the highest rating. What stands out is the difference between the two extremes is highly significant with Vietnamese and Filipinos being twice as likely to use the highest rating on a scale compared to Singaporeans (31 % for VN and PH vs 13% for SG)
Notably, this pattern is consistent even when we look into each scale-length individually. Even on a 11-point scale with more options to choose from, roughly 25% of Vietnamese and Filipino respondents (with Indonesia close behind) are likely to pick the top choice compared to just 9% of Singaporeans.
This shows that no matter which length of scale used, Vietnam and Philippines are most likely to provide the highest rating, whereas Singaporeans steer away from it. The remaining countries sit somewhere in between the two extremes.
.png)
This brings us to the next question. Do these patterns vary depending on the subject matter of the questions?
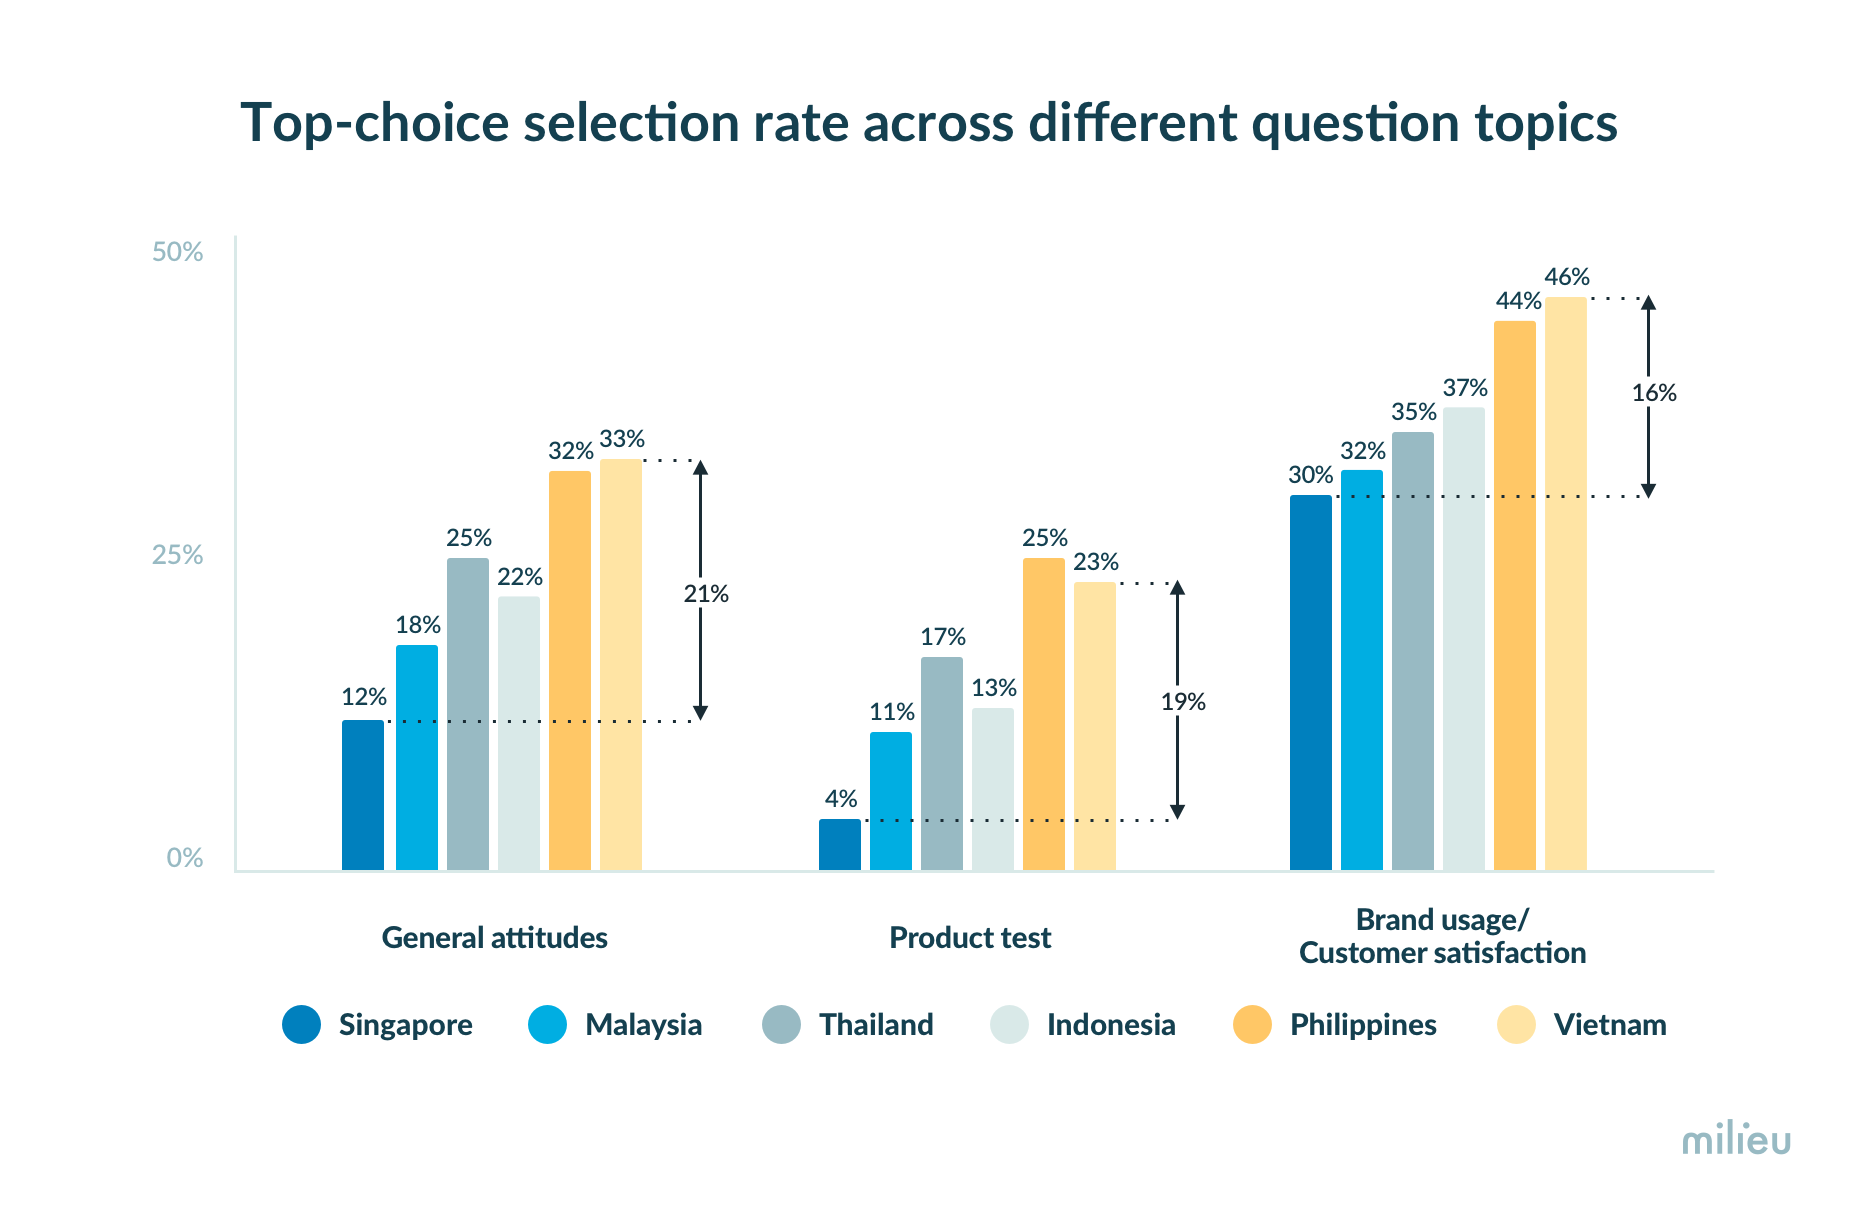
2. Top-choice selection for each country differs dramatically depending on the type of question category
Next, we explored whether response styles differ as a function of the question content. To this end, we compared top-choice ratings across countries for three question categories in the surveys namely, general attitudes, product test, and customer satisfaction questions.
What we find is that the top-box score for each country differs dramatically depending on the type of question category. However, more importantly we find a pattern that is similar to what was observed in the previous section. Vietnam, and the Philippines are most likely to pick the top rating choice across all categories, whereas Singapore is the least likely. The size of the difference is most pronounced between Singapore and Vietnam, and this is pretty consistent across the categories.
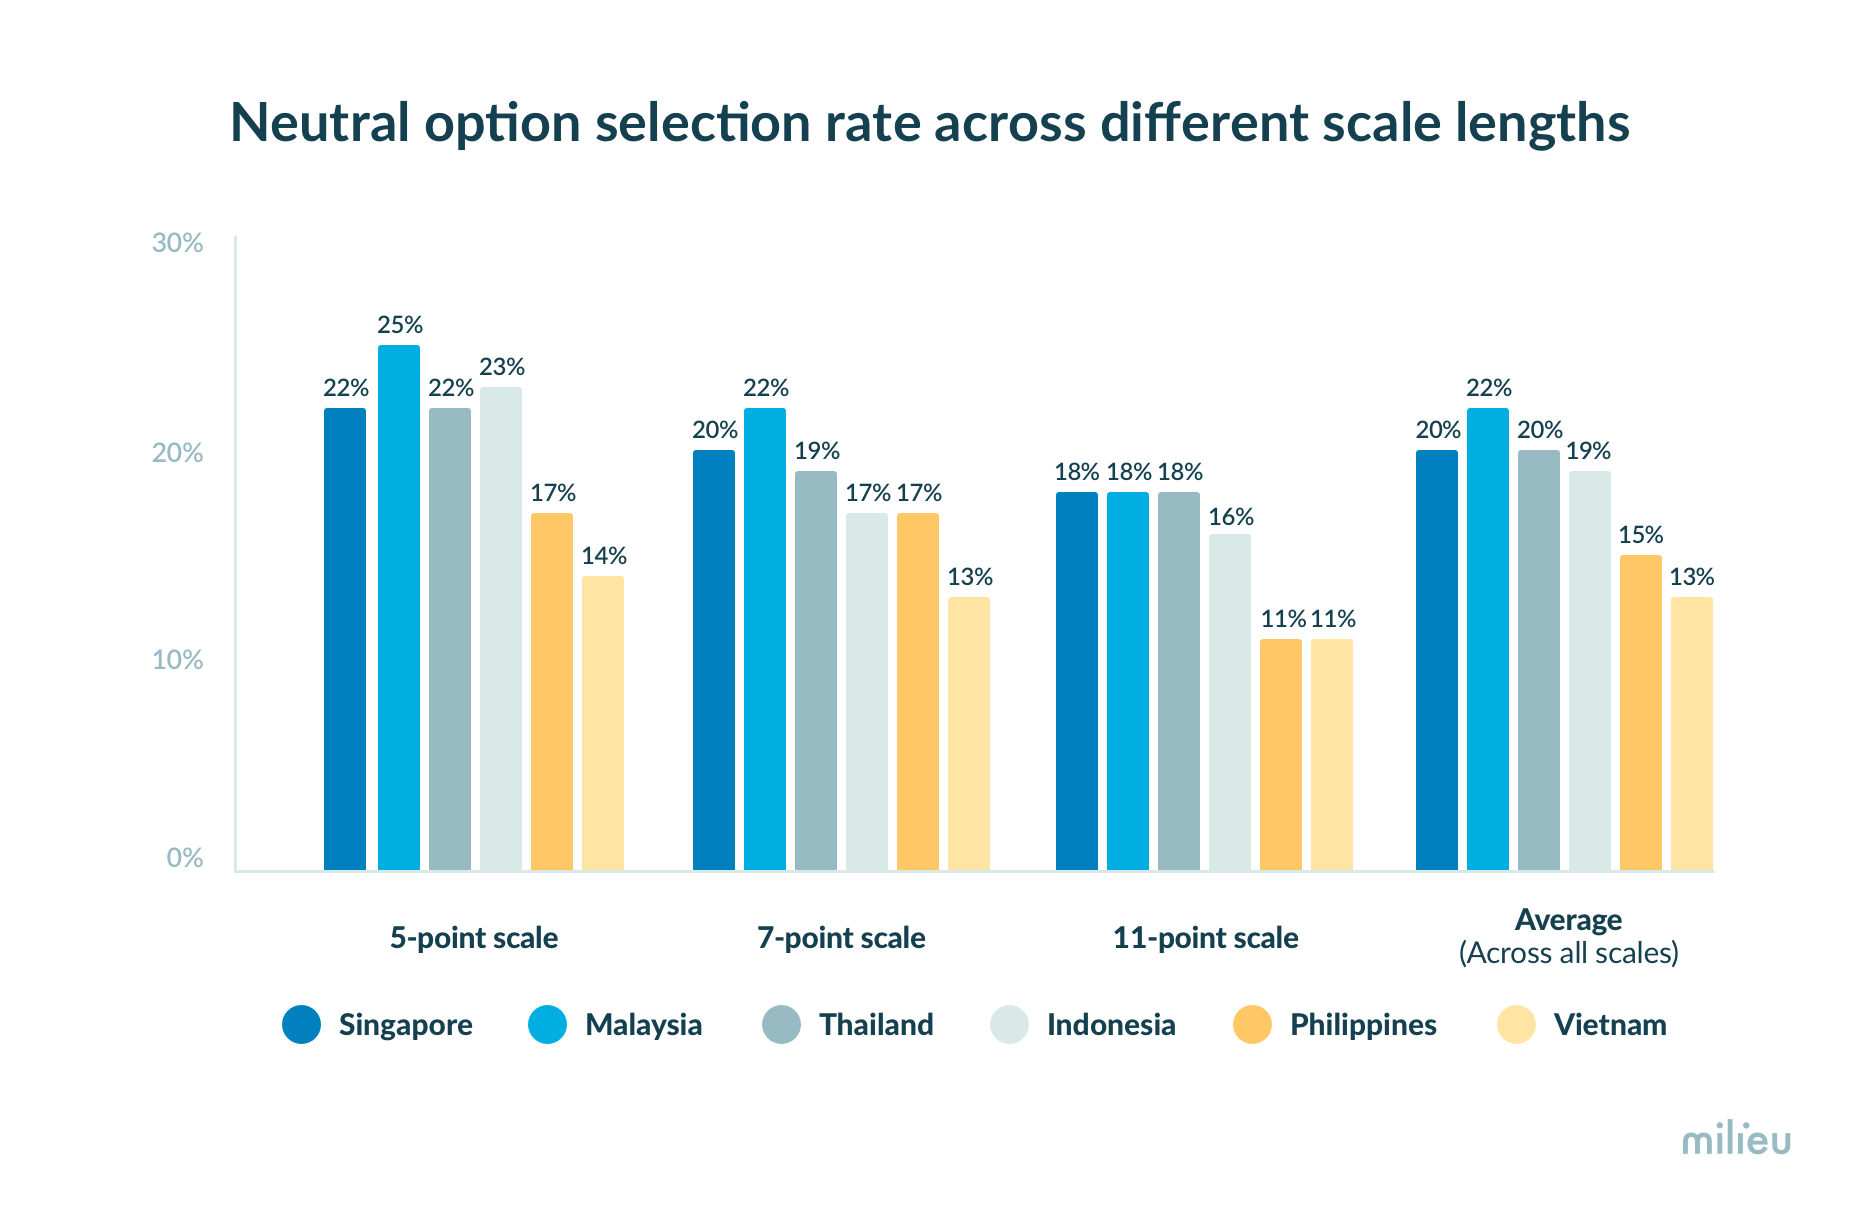
3. Neutral responses : Some markets tend to be consistently more “neutral” in their responses
The graph below shows the selection of neutral responses by country, for each scale length. Malaysian and Singaporean participants selected neutral response options at a higher rate relative to the other markets, on average selecting neutral 20% - 22% of the time (ranging from 18% to 22% for Singapore and 18% to 25% for Malaysia). Contrary to the pattern with the top-box scores, Vietnam was least likely to opine neutrally averaging at 13% (ranging from 11% to 14%). Malaysian and Singaporean participants were on average 1.7 times more likely to rate neutrally compared to Vietnamese respondents.
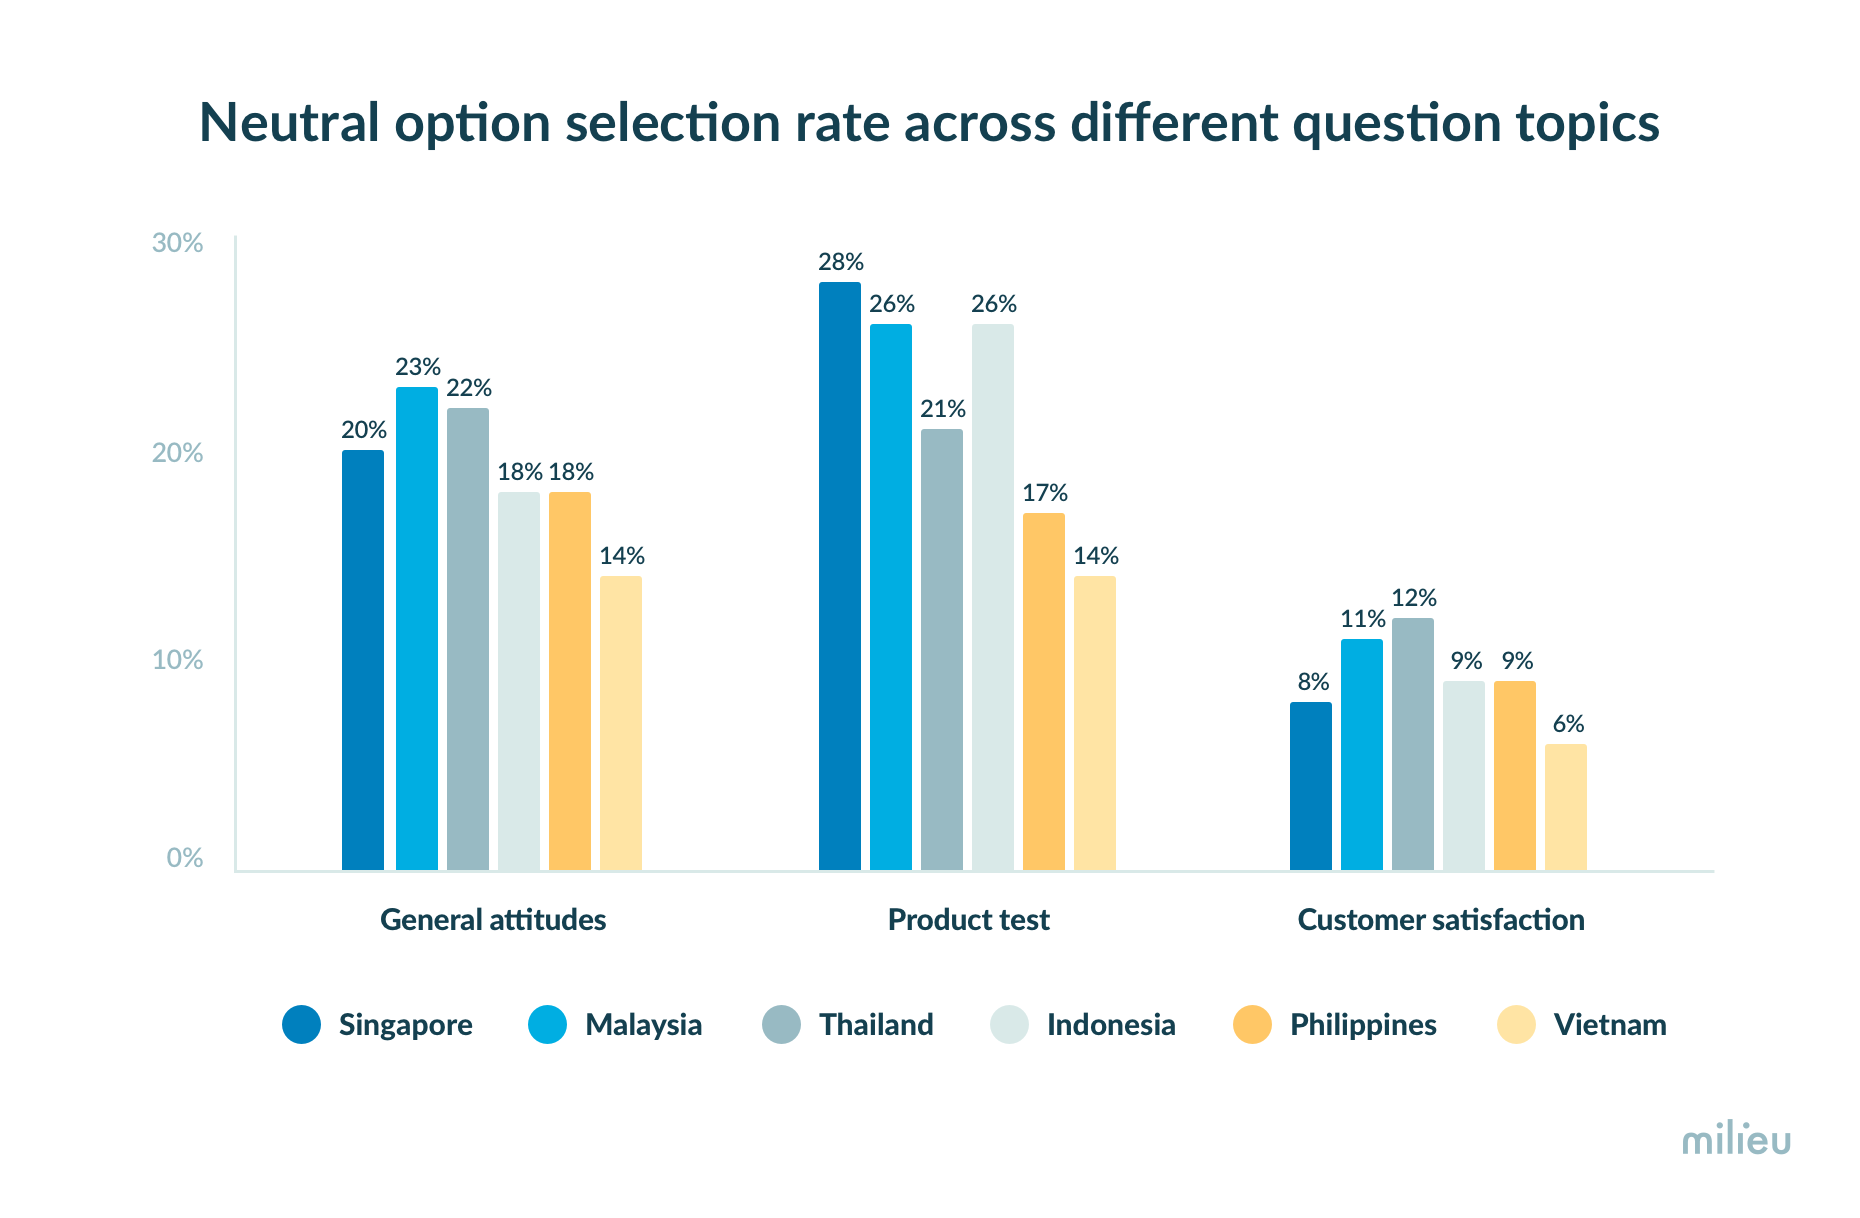
Notably there were prominent variations in country-level neutral responses depending on the question content. While Singapore is most likely to rate neutral for questions that were related to product design test, Malaysia and Thailand were most likely to choose the neutral option for questions related to general attitudes and customer satisfaction.
Vietnam was consistently least likely to pick a neutral response across all question types.
Overall, neutral responses were significantly lower for customer satisfaction questions with lesser variance among countries compared to the other two categories. This is likely because the questions were anchored to actual usage and experience of respondents’ current smartphone, and respondents are likely to be opinionated about it unlike questions on general attitude and product design feedback which can be more abstract.
4. Design format of the scale can significantly impact results
Another important factor to consider would be the visual format of response scales. To be more specific, how you choose to display the response scale and the default value can impact user experience differently across countries.
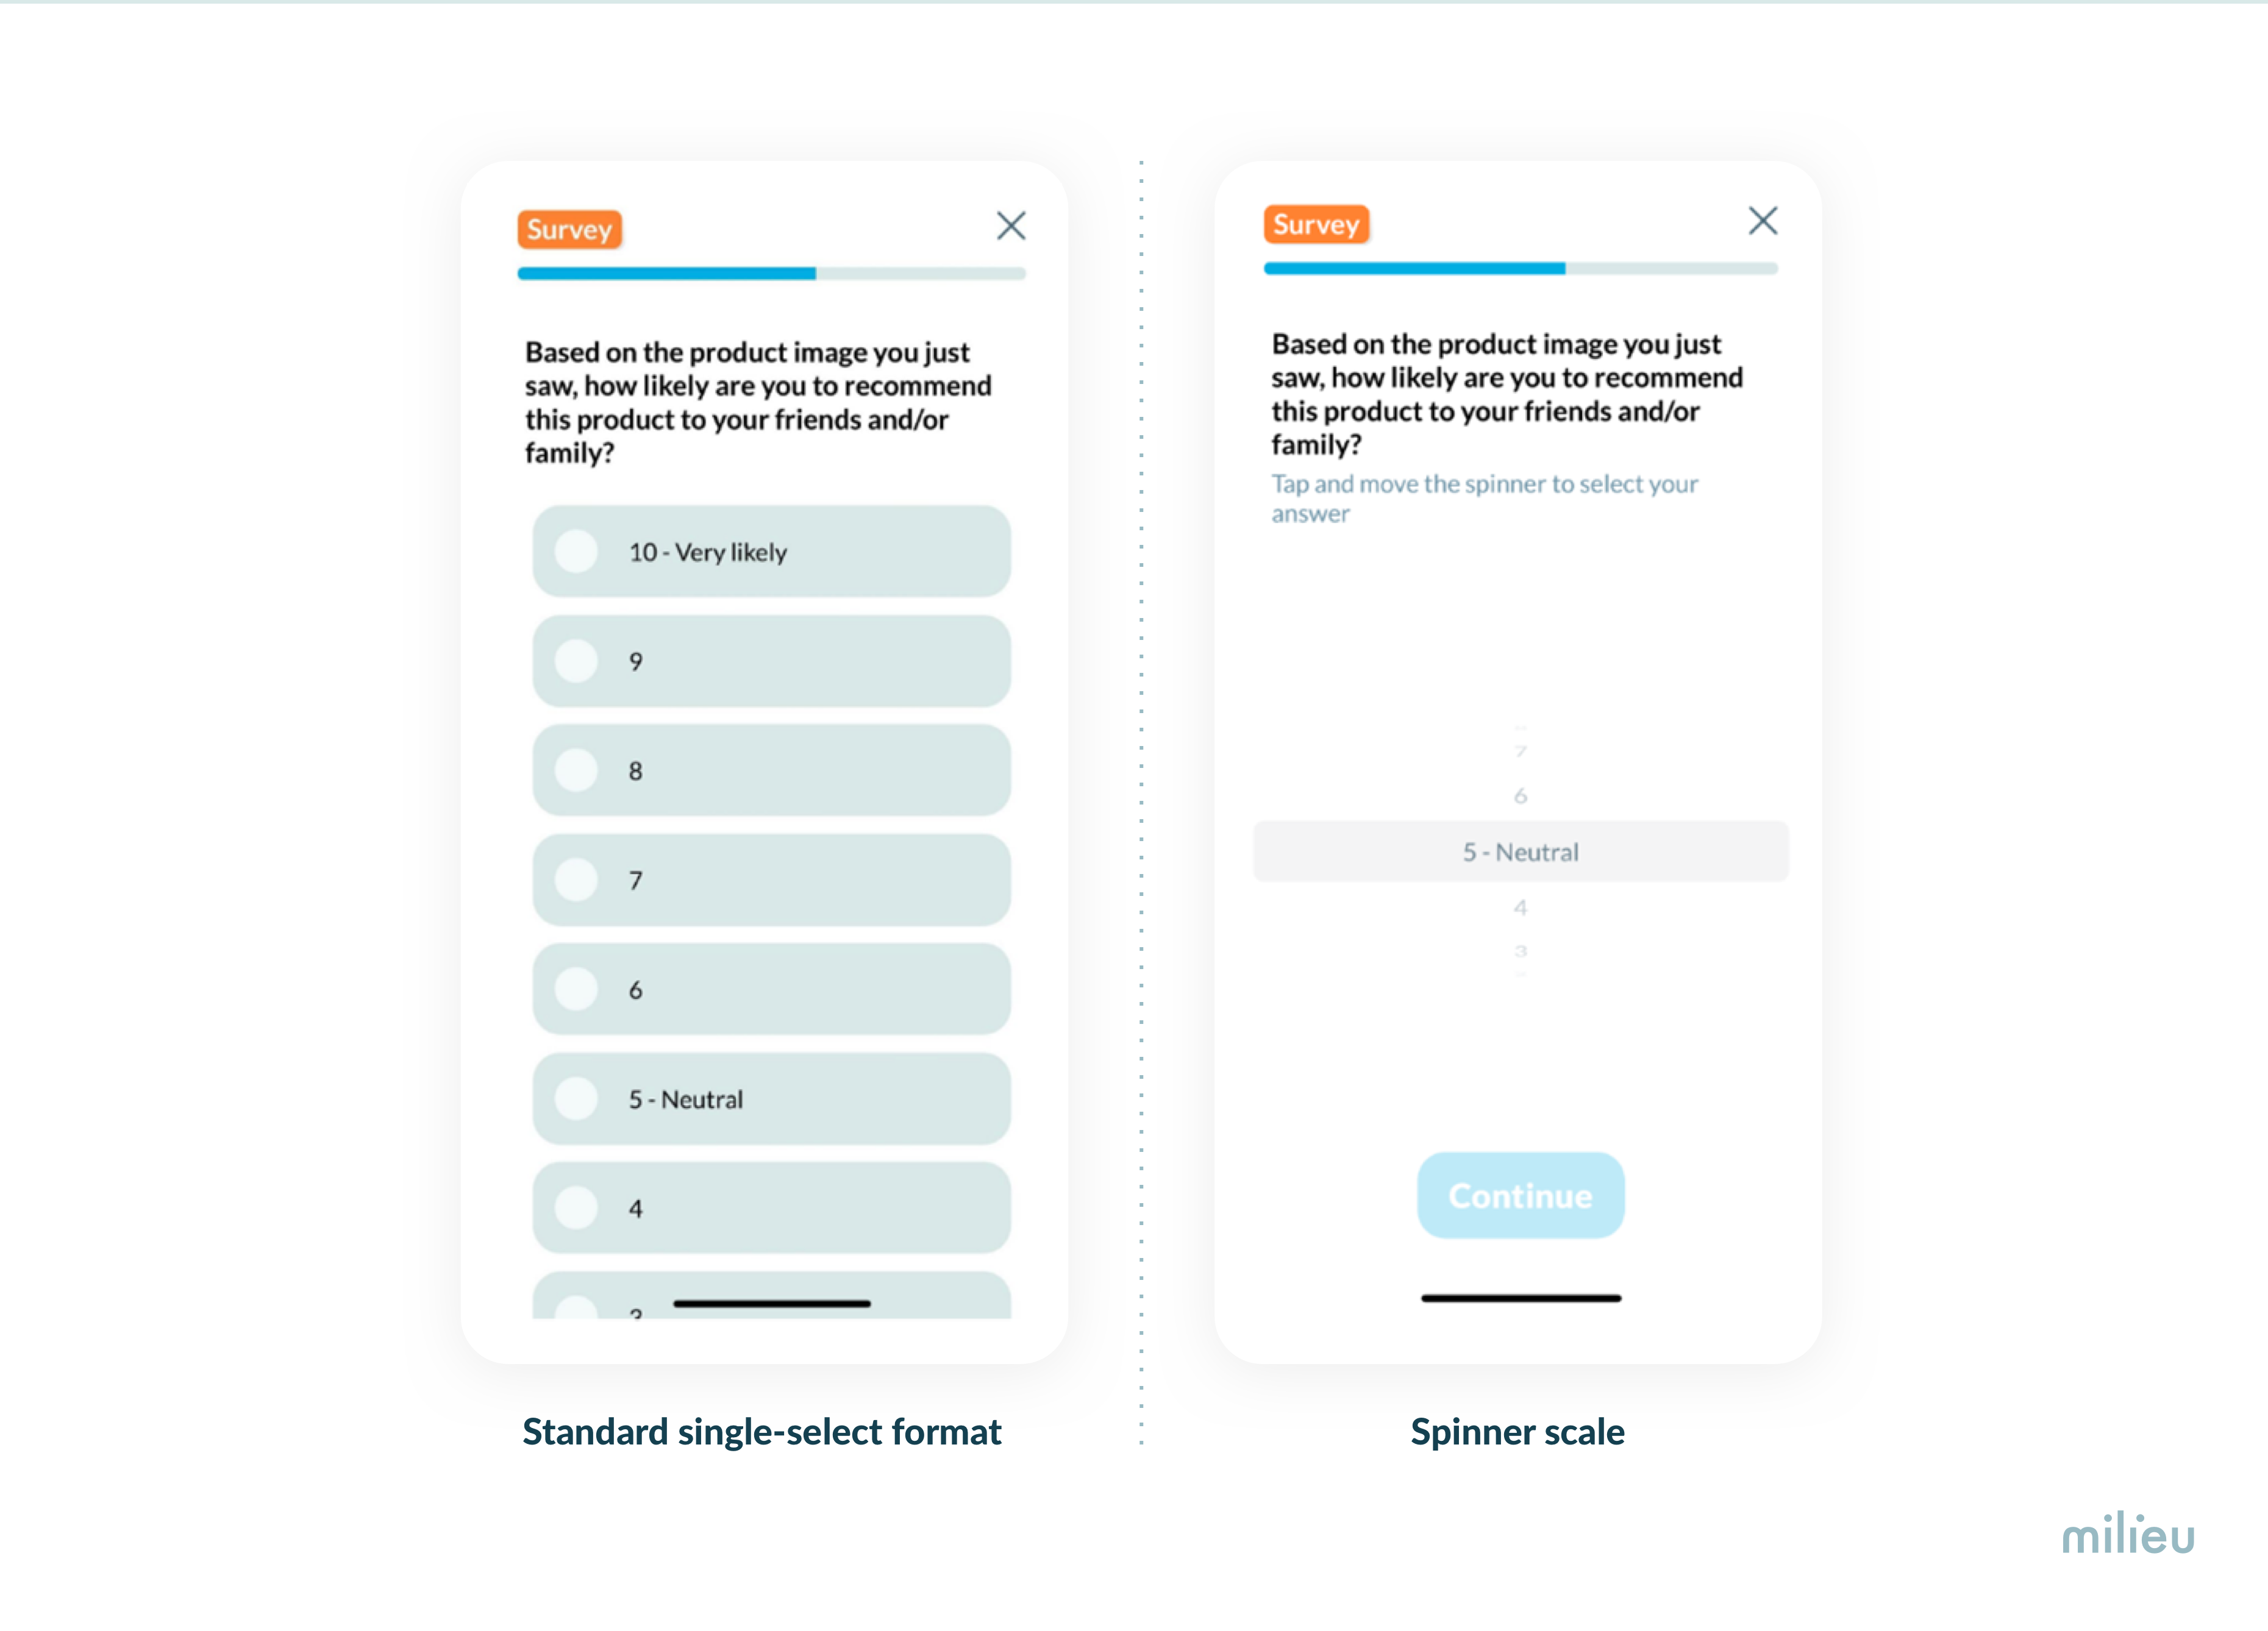
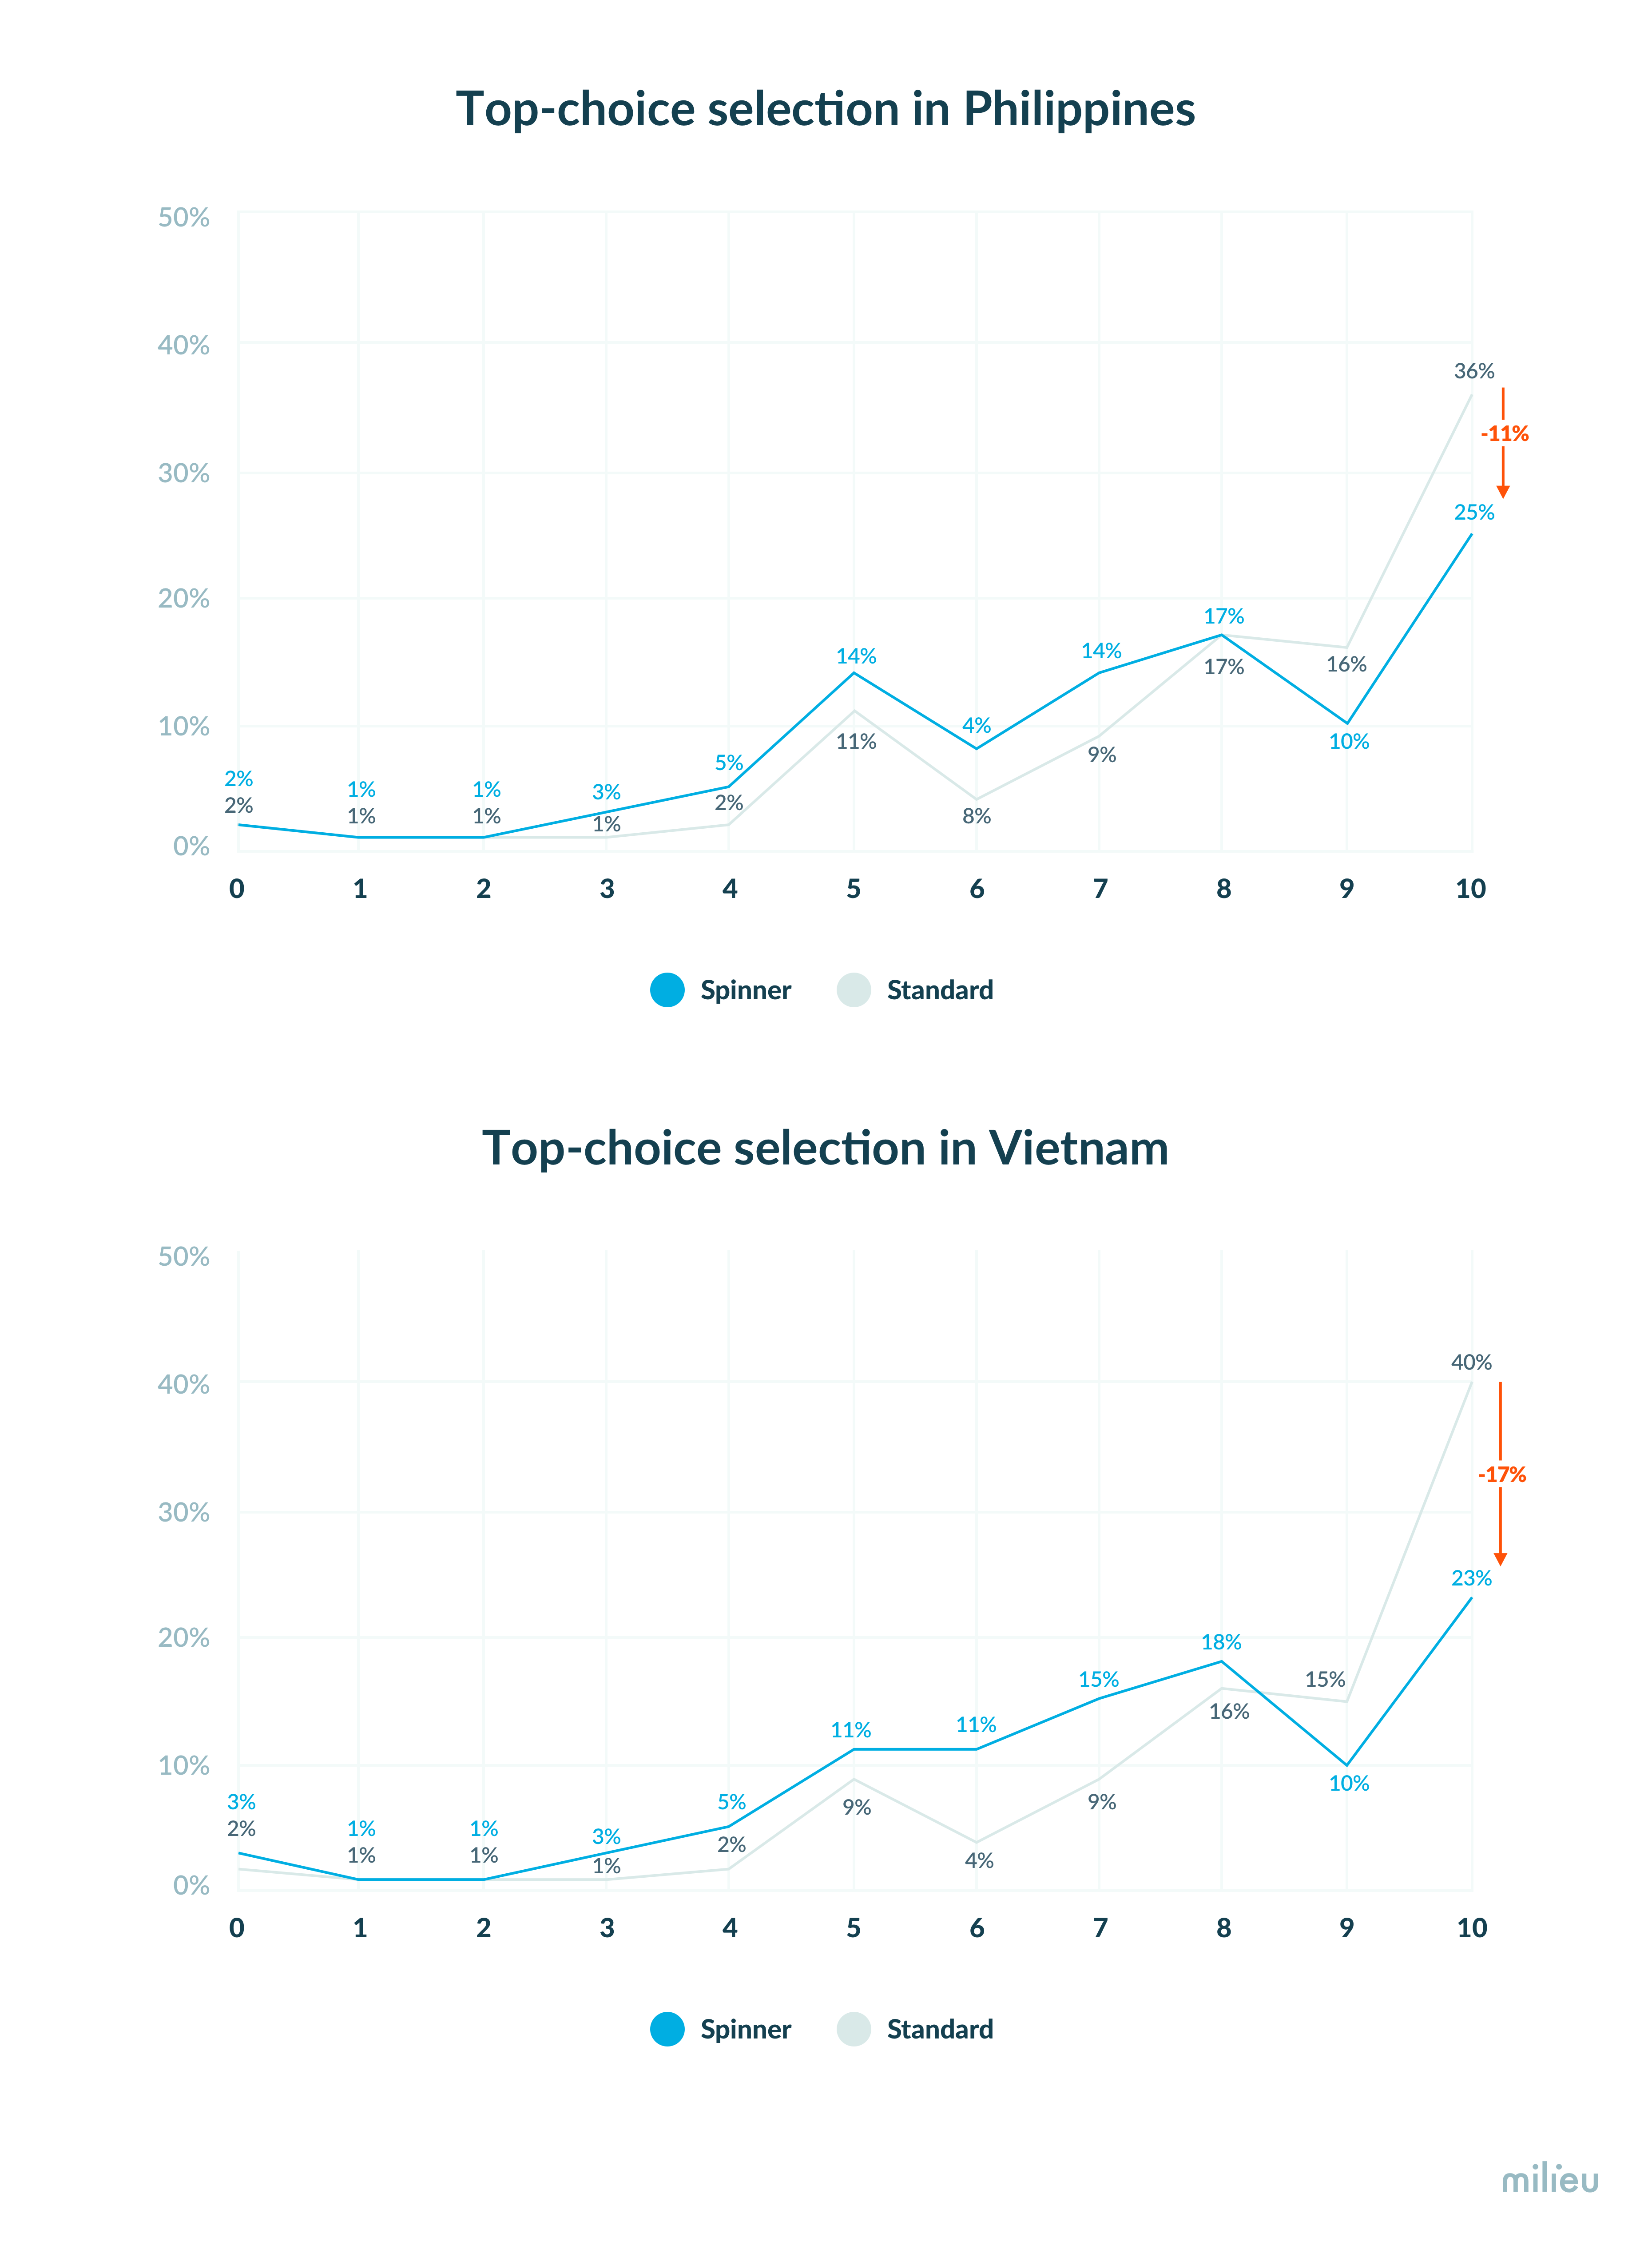
Our research found that the format in which the scale is presented to the respondent can have a significant impact on the results. For example, we ran one version of our test using a standard single-select rating scale (shown on the left below), as well as another format where we show the respondents the same scale using a spinner format, which is native format on iOS and Android devices (shown on the right below). The spinner was also configured so the default was to display the middle of the scale (i.e. 5) upon loading the question, and the respondent needed to interact with the spinner in order to proceed to the next question. Our findings showed that the spinner design helped to reduce top-choice bias by a significant margin for countries that exhibited the strongest bias (in our study Vietnam and Philippines).
For a 11-point scale (which is commonly used in NPS ratings), Vietnam is approximately twice as likely to pick the top-box on a standard scale relative to the spinner scale (40% on a standard scale vs 23% on a spinner scale).
What does this mean for cross-country comparison of data?
The size of differences in cross-country results for certain countries might be a research artefact and not reflective of actual observed results. In this case, the difference between say Singapore and Vietnam might be exaggerated due to poor response scale design that contributes to response bias.
Some other platforms find that using a visual format for rating scales can reduce inter-country variance by almost a third. Visual formats often work well on desktop screens, however they translate to a poor user experience when used on a smartphone screen. Avoid the standard single-select format for long response scales and explore alternative rating scale formats to see what suits your research methodology and needs the best. What’s important to consider is that smartphone screens have limited real-estate. Scales that can be optimised for it will yield better results.
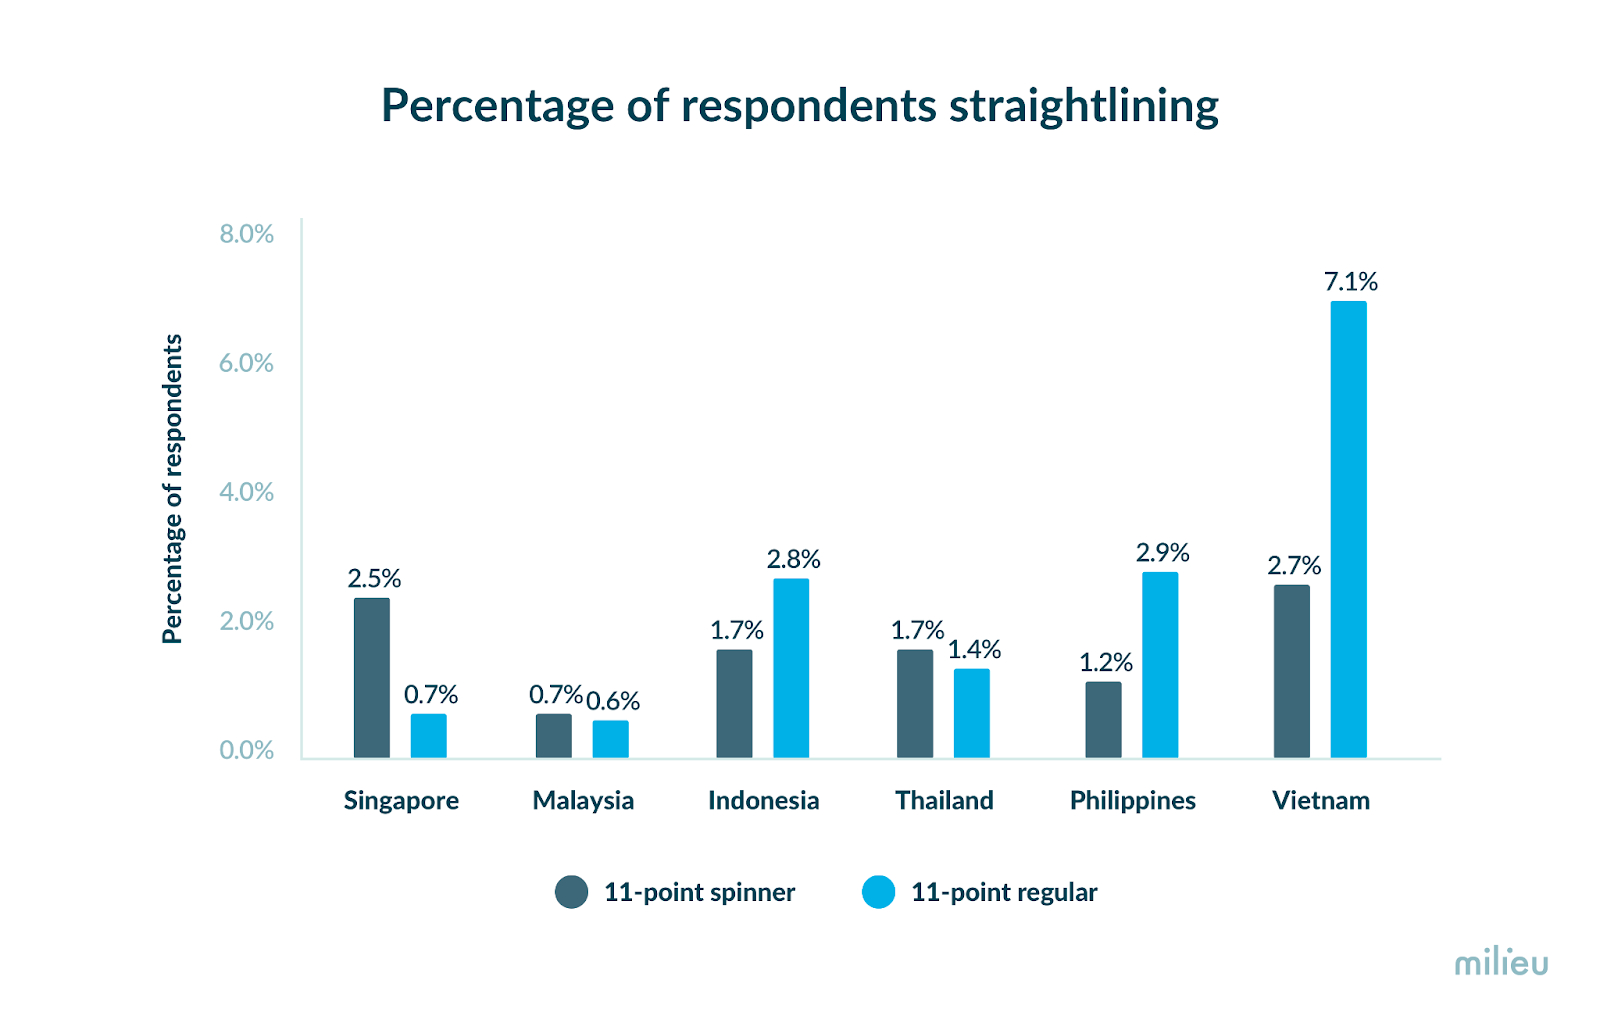
But how do we know that top-box response behaviour in a spinner scale is more reliable that the standard scale? We looked into straight-lining behaviour, i.e. the tendency to select the same response option across different questions irrespective of what your “true opinion is”. We observed that respondents in Vietnam and Philippines are significantly more likely to exhibit straight-lining behaviour for the 11-point standard scale relative to the 11-point spinner scale (see graph below). This suggests that the spinner scale is helps reducing poor survey-taking behaviour.
Milieu Insight is a respected survey software and market research agency, committed to guiding businesses in their data-centric strategies.

Author
Antarika Sen
Latest Insights
.webp)